1. Interview a sample of 10 – 15 Form 5 students taking Additional Mathematics this year regarding the following TWO ASPECTS:
(a) The number of hours each student spent in doing Additional Mathematics exercises per week on the average,
(b) The respective TOV marks in Additional Mathematics.
Record the data collected in a suitable table with the variable x representing aspect (a) and variable y representing aspect (b).
Examples:
No.
|
Student's Name
|
Time Taken Study in 7 Days
|
Average Hours, x
|
TOV Marks, y
|
Gred
| ||||||
SUN
|
MON
|
TUE
|
WED
|
THU
|
FRI
|
SAT
| |||||
1
|
A
|
2
|
1
|
4
|
4
|
5
|
1
|
3
|
2.9
|
51
|
C
|
2
|
B
|
2
|
3
|
0
|
1
|
4
|
0
|
5
|
2.1
|
48
|
C
|
3
|
C
|
4
|
4
|
3
|
4
|
2
|
5
|
3
|
3.6
|
71
|
A-
|
4
|
D
|
0
|
5
|
4
|
5
|
3
|
3
|
2
|
3.1
|
77
|
A-
|
5
|
E
|
3
|
0
|
3
|
1
|
1
|
2
|
3
|
1.9
|
21
|
G
|
6
|
F
|
4
|
0
|
5
|
3
|
3
|
4
|
5
|
3.4
|
65
|
B+
|
7
|
G
|
4
|
1
|
3
|
0
|
2
|
5
|
1
|
2.3
|
46
|
C
|
8
|
H
|
4
|
5
|
3
|
0
|
4
|
4
|
0
|
2.9
|
56
|
C+
|
9
|
I
|
2
|
1
|
1
|
4
|
3
|
0
|
0
|
1.6
|
20
|
G
|
10
|
J
|
4
|
5
|
5
|
5
|
3
|
3
|
3
|
4
|
74
|
A-
|
11
|
K
|
5
|
4
|
0
|
0
|
3
|
2
|
3
|
2.4
|
41
|
D
|
12
|
L
|
2
|
4
|
5
|
0
|
5
|
1
|
2
|
2.7
|
51
|
C
|
13
|
M
|
1
|
2
|
3
|
2
|
0
|
1
|
2
|
1.6
|
26
|
G
|
14
|
N
|
2
|
3
|
1
|
4
|
5
|
3
|
0
|
2.6
|
53
|
C
|
15
|
O
|
0
|
5
|
1
|
1
|
5
|
0
|
2
|
2
|
23
|
G
|
2. Plot the points ( x ,
y ) obtained on the Cartesian
plane.
Discuss.
[ based on Part C Note 2.].
Examples:
3. Calculate the Pearson
correlation coefficient
for the data and interpret the answer based on the notes.
Examples:
Examples:


How to make 2 graphs in a same axis:
- Instructions:
- Sample file in Excel |Download|
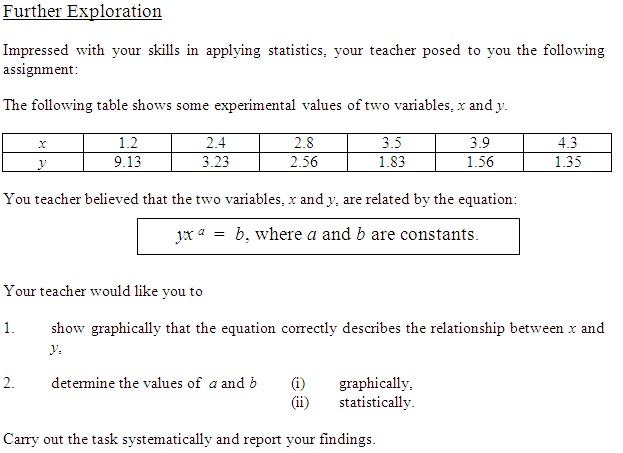
2. Determine the values of a and b
- Graphically (you get from the graph) - the same ways like in physics via gradient
- Stastically (you get from the formula)


.bmp)

